H&R2019 Lecture Series: A Christmas Special TripleHeader! #FOAMed, #FOAMer

Happy holidays to all, here is a little gift from H&R2019!

So here’s a gem from Kylie, who is my reference point for GI POCUS. Ever since this lecture I’ve been working on upping my abdominal scanning capabilities!

GI POCUS with Kylie Baker


Also, if you’ve been working on your Doppler applications, best do so while truly understanding it, both strengths and pitfalls. Here’s the physiology master shedding some light and some insights.

Advanced Doppler with Jon-Emile Kenny


And finally, for the airway fans, here’s Rory Spiegel (@EMNerd) sharing his skills with the bougie.

The Art of the Bougie with Rory Spiegel


cheers

Philippe


For more lectures that will change the way you practice medicine, do try to make it to H&R2020! It is the very ethos of this small conference, to exchange with docs pushing the envelope of acute care as well as like-minded peers. This isn’t the conference to go to if you want to see what most people do and review guidelines. This is the one to go to if you want to be on the cutting edge. Only 100 spots, has sold out every year.  For more info and registration click here!

#FOAMresus Case from Amand Thind (@Thind888)

So #MedTwitter is truly an incredible forum for case discussion, where you get to exchange with literally some of the best medical minds on the planet who often also happen to be front-line clinicians in the nitty-gritty therapeutic decision-making. Here’s a discussion which I think was great. Recently, Dr. Thind has been generating some great cases and hemodynamic discussions. I thought this one was worth highlighting!
Dr Thind is an internist and currently Critical Care Hospitalist (and upcoming ICU fellow) at the Cleveland Clinic, and tweets out some great #FOAM from @Thind888 on twitter.
Case:
OK, let’s give this a shot. Here’s a ‘hemodynamics special’. Saw this case a couple weeks ago. A lot of decision making was based on educated guesses so it should be a good one for discussion. – 51 yo woman being worked up on the floor for chronic diarrhea, moved to ICU for hypoxia.
Dyspnea progressed over few hours. Vitals significant for tachycardia (140s) and hypotension (MAP in low 60s). On arrival, SBP 60s – improved with fluid bolus. CXR attached. Patient has H/O of pericardial effusion for several months that has been managed conservatively. 
The patient has an official ECHO performed on arrival in ICU (images attached). IVC difficult to assess but about 2cm without collapse. Lung US – diffuse B lines. 
OK so right there a flag goes up for me. A plethoric IVC means something is wrong. Sounds too vague maybe, but you need to find the reason for this, as it likely has therapeutic implications. Let’s see what comes up.
Modifed A5C.
LVOT doppler

Image

Image

Image

CXR

Image

Pressing questions –
(i) Is it hydrostatic or increased permeability pulmonary edema?
(ii) Fluids, diuresis, or none?
(iii) Would CPAP help?
(iv) Drain the pericardial effusion?
(v) What about that LVOT doppler? 
Mitral inflow velocities and TDI attached. M-mode through PLAX almost uninterpretable. Lung infiltrates are new so less likely lymphangitic carninomatosis. Note: ScVo2 = 40s. Another Q to ponder on –
(vi) Is tamponade typically associated with hydrostatic pulmonary edema?

Image

Image

Image

Image

Perhaps this slowed up (0.5x) A3C loop will help with that LVOT doppler!

Great discussion as expected. Lets discuss:
Q4. Is it tamponade? – This is not a slam dunk. Chamber collapse can sometimes be controversial. In these situations I try my best to get MV E-wave variation. I think our tech got a decent signal. But note these are fused E/A waves.
The first thing I look at to screen for tamponade is the IVC. Tamponade is an obstructive form of shock, dependant on the intrapericardial pressure exceeding the right atrial pressure. If it does, unless respiratory efforts are extreme, the IVC should become plethoric. Hence, the absence of such would make the effusion – given the current RA pressure – NOT tamponade. Yet again, another point scored by the IVC for usefulness.
Although I don’t see why we can’t use fused waves for this purpose (couldn’t find anything on it in the literature). Note that in spite of the cardiac motion, the mitral inflow variation is <25% (~23%). It’s close though, and certainly seems to have increased from 3 days ago.

Image

The cardiologist (understandably) was non-committal and read it as “possible early tamponade”.
Q5. What about LVOT doppler? A good M-mode could not be obtained but the A3C in 6/ shows SAM. The report mentioned “chordal SAM” but I think you can clearly see “valvular SAM” too.
Chordal SAM is SAM of the chordal apparatus (you could see it bumping against the septum in 6/). It is (typically) NOT hemodynamically significant (PMID: 27241937). – When we see mitral SAM, it is important to quantify its hemodynamic effects – with LVOT peak gradient via CW.
In HOCM, DLVOTO is defined by an LVOT gradient of >30; >50 is considered severe. Our patient had a gradient of ~70. Although classically a/w HCM, SAM can be seen in anyone with thick, hypercontractile, underfilled LV. Tachycardia further hampers LV filling (PMID: 27726435).
Mitral SAM is often a/w MR – this acute MR can cause flash pulmonary edema. These patients may actually need fluids (to help with SAM) to fix there hydrostatic pulmonary edema!! (PMID: 20661209). However, our patient only had trace MR (you could see it in 1-2 CD frames).
Working theory (similar to Lars) – Chronic stable pericardial effusion –> diarrhea (pt had 15 BMs the day before the admission) –> reduced venous return –> brought the patient at the verge of low-pressure tamponade (PMID: 16923755) –> further reduction in LV filling  —> reduced stroke volume –> adrenergic drive causing tachycardia and increased inotropy –> all factors culminating in mitral SAM and DLVOTO.
This also explains the low ScVO2. Note – CPAP would further reduce venous return (Q3) so wouldn’t help, may hurt.
Now the most important Qs: why pulmonary edema and what to do about it (Q1 and 2). As tamponade causes impedance to venous return, it is not typically associated with high LAP and hydrostatic pulmonary edema (Q6).
But first, let’s check out another CW tracing. Any thoughts?

Image

Image

This is a CW beam through LV apex and mitral valve – typically performed to assess mitral inflow and MR velocities and is part of the standard ECHO exam. However, the tracing is not typical for MR (late peaking, dagger shape). Remember, CW does not have depth resolution.

Image

This is likely mid-cavitay/intra-ventricular obstruction. This is caused by complete mid-systolic obliteration of LV cavity (see PSAX) causing obstruction to the apical systolic flow. Again, seen in hypercontractile, underfilled, thick LV – e.g. sepsis (PMID: 26082197).
Finally – what does the ECHO tell us about LV filling pressures? – E/A ratio: As Lars pointed out, an E/A < 0.8 usually means normal LAP. However, the exception to this is sinus tach. This was shown in a study by none other than Dr. Nagueh (PMID: 9778330). (Also, see image)

Image

The idea is that when early filling (E) is incomplete due to short diastolic time, the LA remains “full” at the time of the atrial kick – causing higher A velocities. NB: In that paper, E/E’ > 10 had a specificity of 95% for elevated LAP in ST. In our case: E/E’ = 75/5 = 15!

Image

Potential contributors of high LAP – (i) SAM-associated MR – ‘trace’ in this ECHO but maybe we didn’t catch it. (ii) Tachycardia – E’ is 5 suggestive of delayed relaxation. Tachycardia causes “incomplete relaxation”. (iii) High afterload – high-grade dynamic obstructions.

Image

So at this point, it’s still contentious but I have my money on hydrostatic pulmonary edema. Will detail our interventions and the remaining course in a bit. …Sorry to make this long but I think it’s worth it!
Now for the home stretch, the remaining course: We realized pericardiocentesis may be required soon but wanted to see if volume helps with (i) Peri-tamponade (ii) Dynamic obstructions. It helped a little – O2 requirements went from 60% HF to 6L NC. BP okay but still tachy.
Day 2: We pushed 2.5 mg metop x2 with concurrent ECHO. LVOT gradient improved from 70s to ~10! (I did not compare mid-cavitary gradient, apologies). Started on 25 bid of PO metop later that night. HR now 90s Day 3: Official ECHO shows improved but persistent gradients.

Image

Image

Evaluation of tamponade was similar to previous ECHO but E-wave velocity variation now 38% –> elective pericardiocentesis: 550 cc removed. Fluid was transudate We also tapped a small pleural effusion pocket: transudate, cx negative (again goes with hydrostatic pulmonary edema).

Image

Day 3 (contd): inc metop to 50 Q12H to blunt the gradients.
Day 4 – HR in 80s. ECHO shows no DLVOTO and non-significant mid-cavitary gradient. Oxygenation improved but still not normal. Why?! Check the E-velocity post-pericardiocentesis: it has jumped to 120 with E/A > 1.

Image

So why is the LAP still high despite no significant dynamic obstruction? – Patients with chronic pericardial effusion may have chronically impaired diastolic filling –> low output –> volume retention (basic CHF physiology). When pericardial restraint suddenly released ––> increased LV preload –> high LAP.
Originally discussed elegantly here: PMID 6877287.
This is especially true if the LV has some baseline dysfunction. Day 5 – We started diuresis! The obvious risk was to precipitate the dynamic obstructions –> metop increased to 50 Q8H.
Day 7: Excellent diuresis (~2-3L negative per day). Hemodynamics stable (SvCO2 normal). Resting HR 60s – 70s. Follow-up ECHO confirmed no dynamic obstructions (see image). Day 8: Finally on room air. Pulmonary infiltrates improved (image). All cx remained negative.

Image

Image

Some dogmalysis offered by this case – – Fluids (probably) helped the pulmonary edema; CPAP/diuresis may have worsened. – IV metop contraindicated in hypotension? Not in this case – Sometimes you may have to diurese someone who recently had DLVOTO, as discussed above.
This case highlights the cognitive flexibility required to deal with hemodynamic puzzles. One thing I would’ve done different is be more aggressive with metop early on as it made a huge difference with DLVOTO. This was quite a ride. Hope you had fun. Feel free to share! 
Much kudos to the treating team, I think this was excellently managed. As Amand says, cognitive flexibility ias absolutely key in assessing hemodynamics, particularly in the grey zones when multiple processes occur and co-exist. Managing this type of case using a recipe-based approach and without POCUS could have let to a poor outcome. 
Now the POCUS used in this case is on another level. Very impressive and allowing incredible insight and certainly many potentially clinically useful Doppler analysis tips for LVOTO and LAP assessment. 
In the end, I think that there were three pathologies, (a) tamponade physiology, (b) dynamic LVOTO, exacerbated by (c) hypovolemia (diarrhea)  I might have approached this differently, had I seen a truly plethoric IVC. In such a case, one can easily see how tamponade physiology would contribute to LVOTO in two ways by creating intracardiac hypovolemia, hence worsening LVOTO both by decreasing LV preload and by the compensatory tachycardia. My first approach would probably have been to drain the pericardial effusion, and reassessing the hemodynamics afterwards, but correcting the intravascular deficit was necessary.
The other important thing this case re-emphasize is that tamponade is not a static diagnosis but a physiological spectrum. For the same given effusion (read intrapericardial pressure – IPP), it is the RA pressure that will determine whether overt tamponade develops. In this patient, it is very likely that a day earlier, there was no frank tamponade, but that after some diarrheal volume loss, the RAP dropped, and now IPP > RAP.  It is important to know this because if you have an effusion and a fairly full IVC, one needs to be very careful with anything that can drop the RAP, meaning diuretics and vasodilators, because these can easily turn pre-tamponade into overt shock.  And, as this case illustrates so well, you might even end up with LVOTO and pulmonary edema!  Which is one of the myriad reasons one should have a basic POCUS exam in every acutely ill patient. These are things a resucitationist needs to know and prepare for.
cheers and thanks again to Dr. Thind!
Philippe

H&R2019 Lecture Series: Denault on POCUS and Delirium! #FOAMed, #FOAMcc

So the pundits still try to claim the lack of evidence for the use of POCUS, bla, bla bla. Just wait till they get a load of this: POCUS in delirium? Master Andre Denault introduces us here to a completely new way of assessing a little known potential aetiology of acute delirium.


Here it is, certainly one of the most interesting and forward-thinking lectures of H&R2019:

Denault on POCUS and Delirium.


Don’t forget The Hospitalist & The Resuscitationist H&R2020 is happening May 20-22 and registration is open! Seating is limited…

cheers!

Philippe

H&R2019 Lecture Series: Felipe Teran on Intra-Arrest Hemodynamics! #FOAMed, #FOAMcc

Here is an awesome lecture by Felipe Teran from this year’s H&R:


In resus, there is no one size fits all.


For anyone who missed H&R2019, you can still catch the Essentials!


But more importantly don’t forget that registration for H&R2020 is now open!


cheers!


Philippe

POCUS Skill: Bedside Percutaneous Cholecystostomy. #FOAMed, #FOAMcc

So one thing we all pretty much agree on is the importance of source control. Biliary sepsis is one of the more common causes of intra-abdominal sepsis, and among those, there is a not insignificant proportion of cases where a percutaneous drainage procedure is indicated, often related to an elevated surgical risk.

This is the case of a 90 year old man with severe aortic stenosis and a perforated cholecystitis with sepsis (AKI, delirium, coagulopathy) admitted to our ICU. Due to the aortic stenosis, surgical mortality was felt to be quite elevated, hence a percutaneous procedure was done.

I am sharing this to make the case that a percutaneous cholecystostomy is not outside the reasonable skill set of a clinician who is both POCUS competent and has solid guided procedural experience (central lines, thoracic or abdominal pigtails, etc) and in my opinion falls into that same category as pericardiocentesis. All the more so for clinicians working in community hospitals without the luxury of a 24/7 IR team, because in many cases, it is simply not reasonable to wait many hours for source control – the fact that the patient may make it alive to the next morning to have a drainage procedure is not relevant, as the ongoing sepsis over several hours may be something he or she does not always recover from in the ensuing days and is not a risk worth taking unless there is no other viable option. In our center the critical care physicians perform this intervention when IR is not available.

Here, an in-plane approach was chosen with a trans-hepatic route in order to avoid potential peritoneal spillage.

POCUS Pearls: 

(1) Always visualize the guidewire inside the intended space.

(2)When dilating, make sure the proximal part of the guidewire within the target area “disappears” ultrasonographically, confirming entry of the dilator. Why? In some cases the wall may give more resistance (particularly an inflammed pericardium) and the dilator may remain outside – cannulation with the catheter will be impossible.

Procedure:


POCUS Clips


And the nasty stuff:


Some relevant articles:

https://www.ncbi.nlm.nih.gov/pubmed/12040818

https://www.ncbi.nlm.nih.gov/pubmed/29519331


Love to hear of others’ experience,


cheers

PS if anyone wants a perc chole workshop at H&R2020 , let me know!


Philippe

The Resus Tracks: A Chat with Domagoj Damjanovic! #FOAMed, #FOAMcc, #FOAMer


So I recorded a chat with Domagoj (@domagojsono in the twitterverse), an anaasthetist-resuscitationist-intensivist from Freiburg a few months ago, but with H&R2019 and its aftermath, been slow in processing a lot of stuff I’ve got stocked… Apologies!

So in this one, DOmagoj and I discuss a bunch of resus topics, from eCPR to tissue oximetry. I’m really jealous of the fact that he does prehospital work with an ECMO van!!! …and with cool gear and of course, POCUS!

Here is the chat, hope it leads to thoughts, discussion and contribution!

And here are some links:

low budget ultrasound simulation
and here’s the editorial in Resuscitation,

cheers


Philippe


H&R2019 Lecture Series: Sharad Patel on Portal Vein Pulsatility and Hyponatremia!


So here was a late-breaker talk at H&R2019. Portal vein pulsatility and hyponatremia by a nephrologist – intensivist. Love it. Sharad, a really great guy, also recently published a case report on this topic.

There is a lot of stuff on venous congestion in the woodwork, some of which we are involved in, but also some springing up from different places, and this is really exciting, because POCUS gives you a non-invasive tool to assess and differentiate pathological degrees of congestion that really nothing else can with as much breadth, and as part of a comprehensive exam.

Venous POCUS is worth learning, and keep your eye on this space for how it evolves as a clinical tool. Our VEXUS classification will soon have some real substance behind it.

For those who want more H&R2019, the Essentials can be found here!

And here’s Sharad!

RV Doppler: Resistance vs. Back Pressure. Jon-Emile Kenny & Korbin Haycock! #FOAMed #FOAMer #FOAMcc #POCUS

So I’m still trying to digest the RVOT Doppler physiology and working my hand at generating the best views and Doppler angles I can (See previous post on RVOT Doppler here). Not sure yet how this will fit in to my clinical practice but I think it’s worth shining a light into this murky pseudo-science of resuscitation. These guys are helping define its potential use… Naturally, this is bleeding-edge stuff. Use it to try to understand what’s going on with your patient’s physiology, don’t use this on board exams! My comments in bold.

Now for the big guns…


Jon-Emile Kenny (@heart_lung), pulmccm.org, heart_lung.org

Hey Guys – great discussion as always!
One thing that I find confusing on this topic, and is helpful – i think – when scrutinizing the literature, is the difference between ‘impedance’ and ‘resistance.’ Elevated vascular ‘resistance’ is often used too broadly; for example, true/pure WHO II pulmonary venous hypertension [say from acute left atrial pressure hypertension, but before chronic, compensatory pulmonary arterial changes] is actually typified by a *decrease* in resistance, but an increase in *impedance.* To make things more confusing, acute left atrial hypertension will often display a high “resistance” mathematically … even though, the true resistance can be low. What am i saying? if you imagine an acute increase in the left atrial pressure, the pulmonary venous beds and pulmonary vascular beds “recruit and dilate” backwards [why we see cephalization on the CXR] typically from the bottom to the top of the lungs up the hydrostatic gradient. Recruitment and dilation actually *increases* the cross-sectional radius/area of the vascular beds — a true decrease in resistance [Poiseuille what?]! But, as these vascular beds are engorged, they reach that infamous, hockey-stick-shaped compliance curve point [go leafs go!], where the vessels become really stiff … that is, the compliance falls such that each ejection the RV throws into this dilated circulation, the pressure rises dramatically [especially the systolic pulmonary pressure] …

This I think is a key concept to understand and keep in mind when analyzing the venous system. The physical characteristics are more akin to a floppy plastic bag or balloon, with little rise in pressure until a certain point, then a sharp one – Jon’s “hockey stick.”  It was Jon who made me realize that, with exposure to chronically elevated right atrial pressures, one could have a very big IVC (say 25-30mm, but in fact a low CVP, whereas in normal IVCs exposed to normal CVPs, that sharp rise in pressure probably occurs somewhere around 20mm. Hence, the + value we use in the PAP calculation using TR Vmax for the RAP may be very inaccurate in chronically elevated PAP… Food for thought.

Thus, the calculated pressure gradient rises and and the calculated resistance falls, but what has actually happened is that compliance has fallen, not “resistance”. More broadly, the term “impedance” is composed of compliance, resistance and something called the characteristic impedance [the Windkessels!]. Typically what abnormal RV Doppler shows you is that *impedance* has risen. At the end, you are often still left with the why? Impedance can rise when “true resistance “falls, but compliance also falls [as above] – yet the calculated RVSP/regurgitant jet will also rise. The linked papers are fantastic, but they both excluded patients with left heart disease, so you can be more confident that the RVOT abnormalities seen are related to true ‘pre-capillary’ problems. I’d be willing to bet [and if there’s data, i’d be interested to read it] that patients with pure WHO II pulmonary venous hypertension have very similar abnormalities on the right side. The key means to distinguish – as Korbin talks about – is really looking at the left heart [E/e’] and clinical context to get a better sense of what’s going on.

What would also be interesting would be to look at acutely “decompensated” true left heart disease in volume overload and correlated with RVOT morphology and great vein Doppler velocimetry. My guess is that as you decongest the pulmonary veins [increase their compliance] that the RVOT envelope “pulsatility” goes away [the RV ejection envelope appears more rounded] as does the venous pulsatility in the great veins and intra-renal veins! It’s all about energy transfer … moving away from excessive potential energy trapped in distensible structures [i.e. congestion] to kinetic energy [normal, forward blood flow]

Jon.


Korbin (@khaycock2)

Thanks for the reply Jon-Emile, as usual you bring an incredible amount of intelligent well thought out points.

As you mentioned, afterload is much better described in terms of the 3-element Windkessel model as resistance is only one component of said model (the other factors being vascular compliance and characteristic impedance). Please correct me if I’m wrong, but I believe that the most practical and easiest way to non-invasively determine arterial load is to calculate the Ea (formula: (SBP*0.9)/SV). This would include all of the factors that determine afterloading conditions instead of simply using resistance as it is only one of those factors.

Clinically speaking, I think it is important to address why afterloading conditions are abnormal when we come across undifferentiated pulmonary HTN in the acute setting. Practically in my mind, this is simply finding if the pHTN is due to post-capillary “back pressure” from elevated left atrial pressures or due to elevated pre-capillary pulmonary vascular resistance (or could be some combination of both of course). Both of these conditions can cause elevated pulmonary artery pressures, as you have pointed out, and there are a few other contributors to the afterload as well that we are ignoring (or else we’d blissfully nerd out all day and forget to take care of the patients).

I agree with this concept. This is what may direct me to use pulmonary vasodilators, whether inhaled or even the choice of milrinone or vasopressin (not a vasodilator per se but a non-pulmonary vasoconstrictor). If all the pulmonary hypertension is post-capillary, there would be little or no benefit. This important decision point is what prompts me to look into this whole right-sided Doppler thing… Let’s see what else Korbin has to add! 

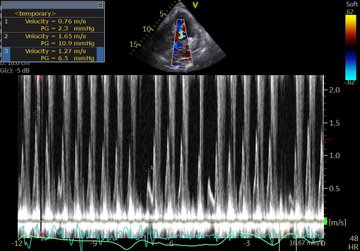
So how can find out the cause(s) of the elevated PAP? Is it resistance or back pressure from the left atrium? This is essentially the topic of the post. Because PVR=(mPAP-LAP)/CO, it has been suggested that the TR gradient can be a surrogate for the mPAP-LAP and RVOT VTI be a surrogate for CO. Thus if the ratio is high, we can assume that a significant component of the pHTN is due to resistance in addition to or to the exclusion of the contribution of LAP. You have rightly questioned and very well explained why you wonder if these are valid assumptions that translate to the finding the clinical causes of pHTN.

You pointed out that the cited papers in the post excluded patients with LV failure, thus bringing into question if the TR/VTI ratio methods and their permutations are actually detecting PVR as the primary etiology of the pHTN or are corrupted by elevations in LAP. Here are 3 papers that included a significant number of patients with pHTN and elevated PCWPs as measured by RHC that show that the TR/VTI methods do seem to work to detect PVR elevations themselves even if the LAP are high:

1) Am J Cardiol. 2013 September 15; 112(6): 873–882. doi:10.1016/j.amjcard.2013.05.016.
2) J Am Soc Echocardiogr 2013;26:1170-7.
3) J Am Coll Cardiol 2003;41:1021–7.

Somewhere in my files I have a study that shows that the mid systolic notch is fairly specific for high PVR and independent of LAP as well. but apologies, I’d have to look for it.

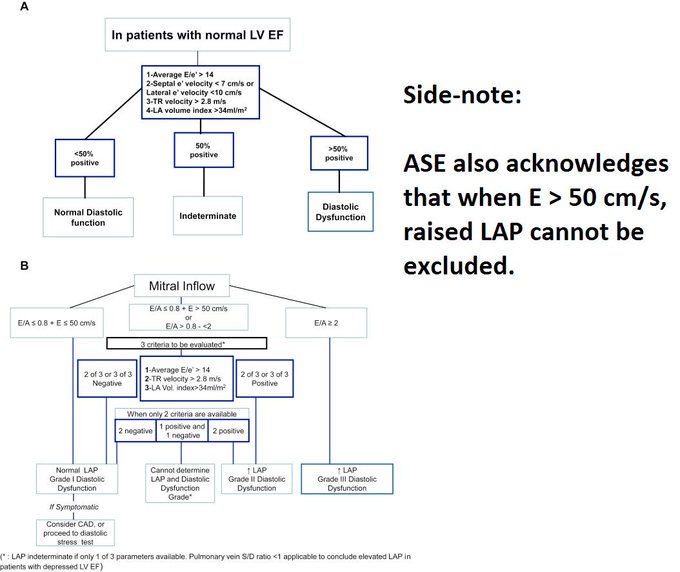
As I might have mentioned in the audio portion of the post (I can’t remember), there is a second method to flesh out PVR from LAP causes of pHTN. First, you need to find a good estimation of the LAP. ECHO has multiple ways of various accuracies to get a number. The formulas are listed above. I don’t believe any of them are validated in acutely sick patients though. Once you have a LAP number, turn your attention to the pulmonary valve regurgitant jet which will almost always be there if there’s pHTN. The wave form is sort of down-sloping trapezoidal lasting through diastole. The velocity at end-diastole can be squared, multiplied by 4, then added to the RAP to give you the end-diastolic PAP. This is normally < 6 mmHg higher than the LAP pressure measurement, if it is a bit more higher, there likely is increased PVR. This is the same principle used in a RHC, where the inflation of the balloon stops flow and therefore eliminates resistance so that the PCWP can be measured and differentiated from the dPAP. The problem with this method is that it doesn’t work as well as the TR/VTI methods

I really enjoyed your thoughts about how Doppler waveform patterns may be affected once compliance limits have been reached, and I’m sure there is something to this that is real as well no doubt! I thought it might be helpful to provide you with the additional studies that included the patients with high LAP, and do a bit of re-explaining/restating your points to anyone new to this stuff.

Thanks again Jon!

Jon replies:

Hey Korbin – thanks for the references – I’ll dig into them. My main concern is that the mPAP-LAP will disproportionately rise (mostly because the sPAP disproportionately rises) when the left atrial pressure is high … that is when it’s actually not a “resistance” problem but rather a back pressure problem, the mathematical resistance is high. As you mention, this is why there’s a push to move away from “PVR” with RHC and more towards the dPAP-PCWP gradient which should be less than 6 mmHg. I made a cartoon describing this in an old post (https://pulmccm.org/critical-care-review/icu-physiology-1000-words-folly-pulmonary-vascular-resistance/). Thanks for these references, I’ll read them and see if they make sense from the framework I’ve adopted – which is entirely stolen from this great article

Naeije, R., et al., The transpulmonary pressure gradient for the diagnosis of pulmonary vascular disease. Eur Respir J, 2013. 41(1): p. 217-23.

Maybe Phil should do a point-counterpoint podcast where Rory comes in at the end and shakes his head because nothing really matters in the end.

“Nihilism rules…”

Jon

Korbin:

Thanks Jon, I would like to see what you think. Thanks back at you for the reference you mentioned in your reply. And you’re hilarious!

Jon replies:

I had a read of the references that you provided, thank you. I think my concerns still apply, however. My main concern is what is being used as the gold standard for ‘pulmonary vascular resistance.’ An elevated calculated pulmonary vascular resistance (e.g. in WU) doesn’t actually tell you where the pathology is. the assumption is that an elevated calculated pulmonary vascular resistance is caused by a high pre-capillary resistance in the pulmonary circulation, but this isn’t necessarily true. as i showed in that post that i linked to (https://pulmccm.org/critical-care-review/icu-physiology-1000-words-folly-pulmonary-vascular-resistance/) … if one were to acutely cross-clamp the descending aorta, below the diaphragm, the calculated pulmonary vascular resistance would rise, even though the pathology is totally outside of the thorax!! i have no doubt that the TRV / RVOT-VTI would also rise in that very same patient with the cross-clamped descending aorta such that the good correlation between the calculated ‘pulmonary vascular resistance’ and the TRV / RVOT-VTI is maintained – but the pathology is in the abdomen – not the pulmonary vascular tree! So many exclamation marks; but i’m not yelling. In a hypothetical patient with a cross-clamped descending aorta, one might be tricked into giving a pulmonary vasodilator — but that would be the absolute wrong thing to do, even though the calculated pulmonary vascular resistance is high. The treatment is to afterload reduce the struggling LV (remove the cross clamp) — which would then lower the calculated “pulmonary” vascular resistance and the TRV / RVOT-VTI.

the problem in reasoning lies in what happens with the left atrial pressure rises (as would happen if one acutely cross-clamped the descending aorta). it is assumed that as the LAP rises that the mPAP – LAP gradient stays the same or rises in proportion. but what happens when the LAP rises is that the mPAP rises disproportionately because of pulmonary vascular engorgement/stiffening (in fact, the pulmonary vascular resistance has fallen because of recruitment and dilation of the pulmonary tree). what *does* rise in proportion is the dPAP – LAP gradient [should stay below 7 mmHg]. i strongly suspect that the ability of the TTE to detect/calculate the dPAP – LAP gradient is not yet refined enough because there is a lot of supposition and inference when making dPAP and LAP measurements with pulsed wave Doppler.

alas, with either an elevated TRV / RVOT-VTI (or calculated pulmonary vascular resistance from a RHC), one still doesn’t know if it’s purely a left-sided problem (e.g. purely elevated LV afterload) – which could seriously alter management. to know that, i think that a full interrogation of the left heart and pulmonary veins must be done before knowing exactly what an elevated TRV / RVOT-VTI specifically identifies. in addition to that vascular resistance post above, i dug into some more of this in a discussion on the SIOVAC trial a while back (https://pulmccm.org/randomized-controlled-trials/choose-wisely-avoid-sildenafil-pulmonary-hypertension-corrected-left-heart-valvular-disease-siovac-trial/) – which, in my opinion, should never have passed ethics.

Jon

So this is really fascinating stuff. I must admit both Korbin and Jon make excellent points, and for now am not sure if and how to use RV Doppler in clinical decision-making, but until then will be sure to polish up these skills so that they are ready for prime time, and use them in observation of physiology in my shock patients. We’ll see what conclusions I draw.

cheers


Philippe

Exploring the Pulmonary Vasculature with Korbin Haycock: RVOT Doppler. #FOAMed, #FOAMcc, #POCUS

So some recent twitter discussions, particularly involving my friend Korbin (@khaycock2) and Lars (@LMSaxhaug) – whom I am trying to get on the podcast soon – were really fascinating in regards to RV and pulmonary hypertension assessment. So time to dig into this a little.
The basic POCUS RV assessment is RV:LV ratio and TAPSE, along with RV free wall thickness (should be below 5mm) and the D sign in parasternal SAX. This is a solid start to screen for significant RV dysfunction.
The next level should be to measure PAP using TR Vmax, in order to assess the degree of pulmonary hypertension. Thats pretty much where I’ve been at for the last few years and wasn’t sure there was really a lot more that was necessary from an acute care standpoint where your immediate questions are fluids/pressors/inotropes and some inhalational pulmonary dilators. I wasn’t convinced I needed more.
But of course Korbin and Lars are on another level, and started to talk about doing RVOT doppler and looking at TR Vmax to RVOT VTI ratios to estimate pulmonary vascular resistance. Is there any difference there? Is my PAP not enough? Well, turns out there may be some useful information there, so I will let Korbin do the talking, and my apologies for my dumb questions during this discussion!
So I will be toying with RVOT doppler and trying to see if this is something that warrants a place in acute care management. I suspect it may be something that may tip towards earlier inhaled vasodilator therapy, or else make not using them a more confident choice. I do like the waveform analysis. I think we generally overlook a lot of good info by focusing on numbers over morphology!
So far, images using the PS SAX view have been quite good:
Additionally, RVOT notching could be suggestive of an acute PE – makes sense (study link here!)
Here are a couple of excellent references:
So thanks to Korbin and Lars for forcing me to up my doppler game some more!
cheers
Philippe
Formula Fun:
Tricuspid regurgitation pressure gradient for sPAP:
sPAP=4*(TRvelocity^2) + RAP or
sPAP=TRpg +RAP
mPAP=(sPAP)*0.61 + 1.9
Acceleration time equations for sPAP and mPAP:
sPAPlog= -0.004(AT) + 2.1
mPAP=90 – (0.62*AT)
Pulmonary Regurgitation pressure gradient:
mPAP=4*(Peak initial velocity^2) +RAP
dPAP=4*(End velocity^2) + RAP
dPAP-PCWP should be about <6mmHg or else PVR is likely, see PCWP equations below
PVR equation to screen for increased PVR, or if PVR < 3 WU:
PVR=10*(TRvelocity/RVOT VTI) + 0.16. TR velocity is in m/sec, if <2 WU, no increased PVR.  This equation is accurate up to 3 WU
PVR equations for increased PVR > 3 WU.  These equations less accurate if PVR < 3 WU:
PVR=5.19*(TRvelocity^2) – 0.4, or more simplified: 5 * (TRvelocity^2). Note that the 5 * (TRvelocity^2 is almost sPAP equation (4 * TRvelocity^2)=sPAP
PVR=sPAP/RVOT VTI if no RVOT notch present
PVR=(sPAP/RVOT VTI) + 3 if RVOT notch is present
PCWP equations (for detection of group 2 pHTN to elevated sPAP), as you know, this is a whole other area, and gets a quite a bit more complicated, but to summarize:
PCWP likely elevated if E/e’>15, unlikely if E/e'<8
In NSR, PCWP=1.24 * (E/lateral e’) + 1.9
In ST, PCWP=1.5 * (E/lateral e’) + 1.5
In atrial fibrillation averaged over 5 beats, PCWP=0.8 * (E/lateral e’) +6
Using color M-mode and propagation velocity: PCWP=5.27 * (E/Vp) + 4.6

“Volume Status” and other meanderings. #FOAMed, #FOAMcc, #FOAMer #POCUS

So the discussions go on about volume status and POCUS, and recently one in particular made me realize that it is important to reframe the way we think about “volume status.” As Segun Olusanya (better known as @iceman_ex) said, “the IVC is not a fuel tank indicator,” and indeed it is not. But even if it was, would that be useful? If somehow, an 18 mm IVC (short axis circular or average of course!) corresponded exactly to a 0.70 ml/kg blood volume, would that be of any use?

No. Of course not.

I get asked this question in consult a lot. So I could be a stickler on principle and answer, whether verbally or in a consult, that the volume status cannot be precisely ascertained using POCUS, and keep walking down the hospital hallway.

But let’s instead reconsider the true clinical question for a moment. What does “volume status” mean when requested by a colleague. The truth is that he or she is likely asking you whether there is a need to give fluid, remove fluid, or stay the course.

Ahhhh. Now POCUS, the IVC and its friends can help. A lot. A lot more that most clinical examinations and chart reviews of weights or ins and outs can. Way more. Why? Because if you are cool, with a normodynamic heart and a small IVC, you are on the low side of volume. Now you may also have a lot of B lines from your pneumonia and the lack of volume tolerance will give your answer to be very careful with fluids. If you are warm and hyperdynamic with a small IVC and totally clear lungs, no elevated ICP and a soft belly, you may just be vasodilated but, if your BP is on the low side, some fluid is a fair go, so long as you follow closely thereafter for fluid stop points. If you have a low urine output, a big IVC, a pulsatile PV and a poor LV, you probably need lasix, no matter how clear your lungs are and even if your creatinine is rising, in fact, especially since it is rising.

The permutations are myriad. But that’s why we have MDs and are supposed to be able to integrate bits and pieces of physiological data to come up with an understanding of our patients. And POCUS gives us an unprecedented bedside view into this physiology.

So if you do have legit POCUS skills, and are able to do a bit more than a long axis M mode of the IVC, then try this instead:

“Sure thing, now tell me a bit about your patient – I imagine you’re debating whether to give some fluids or diurese?”

Forget about volume status in terms of absolutes. Just think of what the clinical question is, and give your colleagues the answers they need.

I think the patients will do a lot better that way.

I’ve already put up a lot of stuff about the IVC here over the years.

cheers


Philippe